, the work of Luca Deri, is
an excellent example of just how useful a point-monitoring tool can
be.
. Actually, it
is a lot
more.
library that originated at the Lawrence
Berkeley National Laboratory and on which
is based. It puts the network interface
in promiscuous mode so that all traffic at the interface is captured.
It will then begin to collect data, periodically creating summary
statistics. (It will also use
can be run in two modes: as a web-based
utility using a built-in web server or in interactive mode, i.e., as
a text-based application on a host. It closely resembles
when run in interactive mode. This was the
default mode with earlier versions of
.
Normally, you will want to use a separate window when using
interactive mode.
8.3.1.1. Interactive mode
Here
is an example of the output with
intop :
$<50>                  intop 0.0.1 (Sep 19 2000) listening on [eth0]
379 Pkts/56.2 Kb [IP 50.5 Kb/Other 5.7 Kb]            Thpt: 6.1 Kbps/24.9 Kbps
 Host                     Act   -Rcv-Rcvd-      Sent   TC-TCP-       UDP     IC$
 sloan                     B     69.0%     16.7%   38.8 Kb         0        0
 lnx1a                     B     16.7%     69.4%    9.4 Kb         0        0
 rip2-routers.mcast.net    R      3.7%      0.0%         0    2.1 Kb        0
 172.16.3.1                B      2.1%      6.5%         0         0        0
 Cisco CDPD/VTP [MAC]      I      4.7%      0.0%         0         0        0
 172.16.3.3                B      2.2%      6.1%         0         0        0
Interpretation of the data is
straightforward. The top two lines show the program name and version,
date, interface, number of packets, total traffic, and throughput.
The first column lists hosts by name or IP number. The second column
reflects activity since the last update -- Idle, Send, Receive, or
Both. The next two columns are the amount of traffic sent and
received, while the last two columns break traffic down as TCP, UPD,
or ICMP traffic.
intop should be started with the
-i option to specify which interface to use. For
example:
lnx1# intop -i eth0
If your computer is multihomed, you
can specify several interfaces on the command line, each with a
separate
-i. Once started, it prints an annoying
20 lines or so of general information about the program and then
gives you a prompt. At this point, you can enter
? to find out what services are available:
intop@eth0> ?
Commands enclosed in '<>' are not yet implemented.
Commands may be abbreviated. Commands are:

 ?              <warranty>       filter          swap            nbt
 help           <copying>        sniff           top            <dump>
 exit            history         uptime          lsdev          <last>
 quit            open           <hash>           hosts          <nslookup>
 prompt         <close>          info            arp
intop@eth0>
As you can see, a number of
commands are planned but had not been implemented at the time this
was written. Most are exactly what you would expect. You use the
top command to get a display like the one just
shown. The
info command reports the interface
and number of packets captured. With the
filter
command, you can set packet-capture filters. You use the same syntax
as explained in
Chapter 5, "Packet Capture" with
tcpdump. (Filters can also be specified on the
command line when
intop is started.) The
lsdev command lists interfaces. The
swap command is used to jump between data
collection on two different interfaces.
You can change how the data is displayed
on-the-fly using your keyboard. For example, the
d key will allow you to toggle between showing
all hosts or only active hosts. The
l key
toggles between showing or not showing only local hosts. The
p key can be used to show or suppress showing
data as percentages. The
y key is used to change
the sorting order among the columns. The
n key
is used to toggle between hostnames and IP addresses. The
r key can be used to reset or zero statistics.
The
q key is used to stop the program.
8.3.1.2. Web mode
Actually,
you'll probably prefer web mode to interactive mode, as it
provides considerably more information and a simpler interface. Since
ntop uses a built-in web server, you won't
need to have a separate web server running on your system. By
default,
ntop uses port 3000, so this
shouldn't interfere with any existing web servers. If it does,
or if you are paranoid about using default ports, you can use the
-w option to select a different port. The only
downside is that the built-in web server uses frames and displays
data as tables, which still seems to confuse some browsers,
particularly when printing.
There are a number of options, some of which are discussed next, but
the defaults work well enough to get you started. Once you start
ntop, point your browser to the machine and port
it runs on.
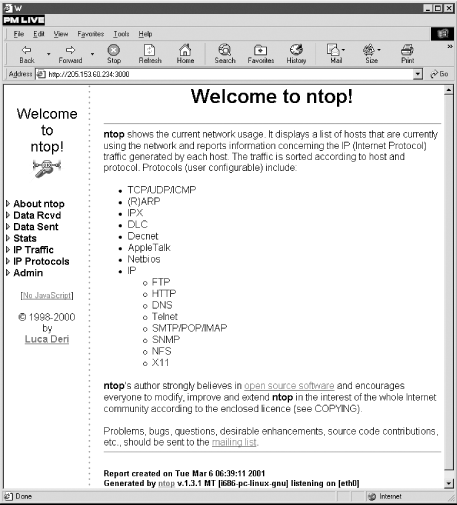
Figure 8-1 shows what the initial
screen looks like.
Figure 8-1. ntop's home page
As you can see, on startup
ntop provides you
with a brief description of the program in the larger frame to the
right. The real area of interest is the menu on the left. By clicking
on the triangles, each menu expands to give you a number of choices.
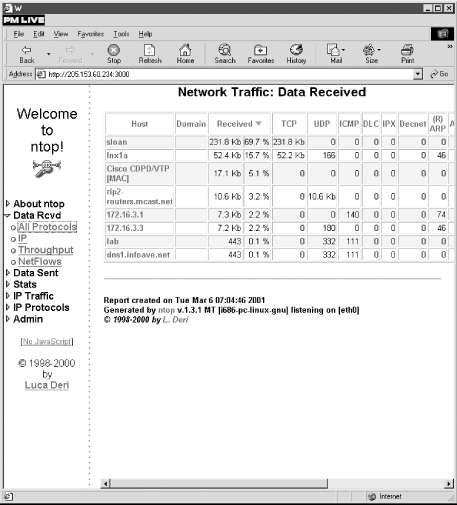
This is shown to the left in
Figure 8-2.
Figure 8-2. ntop's All Protocols page
Figure 8-2 shows
the All Protocols page, which groups traffic by protocol and host.
This is available for both received and transmitted data. A number of
statistics for other protocols -- such as AppleTalk, OSPF,
NetBIOS, and IGMP -- have scrolled off the right of this window.
You can click on the column header to sort the data based on that
column. By default, this screen will be updated every two minutes,
but this can be changed.
The IP option displays received or
transmitted data grouped by individual IP protocols such as FTP,
HTTP, DNS, and Telnet. The Throughput option gives a table organized
by host and by throughput, average throughput, and peak throughput
for both bits and packets.
The
Stats submenu offers a number of options. Multicast gives a table of
multicast traffic. Traffic provides you with a number of tables and
graphs showing how traffic breaks down.
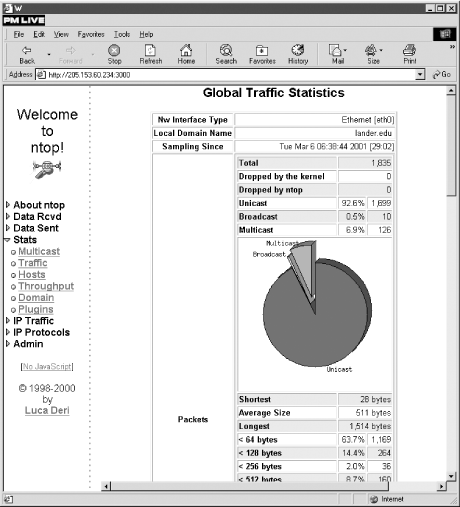
Figure 8-3
shows one of these graphs.
Figure 8-3. ntop's Traffic page under Stats
Figures and tables break down traffic
by broadcast versus unicast versus multicast packets, by packet size
categories, by IP versus non-IP traffic, by protocol category such as
TCP versus UDP versus AppleTalk versus Other, and by application
protocols such as FTP versus Telnet. Either bar graphs or pie charts
are used to display the data. The tables give the data in both
kilobytes and percentages. These graphs can save you a lot of work in
analyzing data and discovering how your network is being used.
The Host option under Stats gives
basic host information including hostnames, IP addresses, MAC
addresses for local hosts, transmit bandwidth, and vendors for MAC
addresses when known. By clicking on a hostname, additional data will
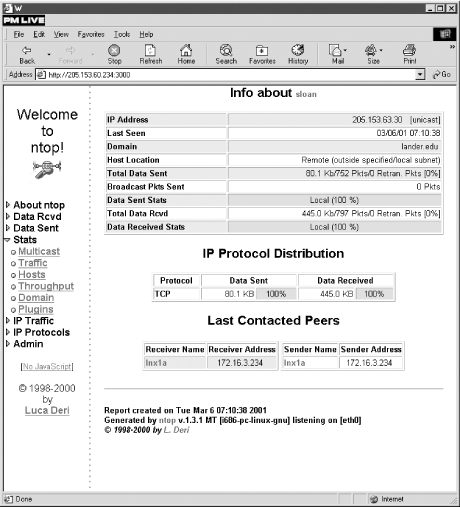
be displayed as shown in
Figure 8-4.
Figure 8-4. Host information
The host shown here is on a different
subnet from the host running
ntop, so less
information is available. For example, there is no way for
ntop to discover the remote host's MAC
address or to track traffic to or from the remote host that
doesn't cross the local network. Since this displays
connections between hosts, its use has obvious privacy implications.
The Throughput option
gives a graph of the average throughput over the last hour. Domain
gives a table of traffic grouped by domain. Plug-ins provide a way to
extend the functionality of
ntop by adding other
applications. Existing plug-ins provide support for such activities
as tracking new ARP entries, NFS traffic, and WAP traffic and
tracking and classifying ICMP traffic.
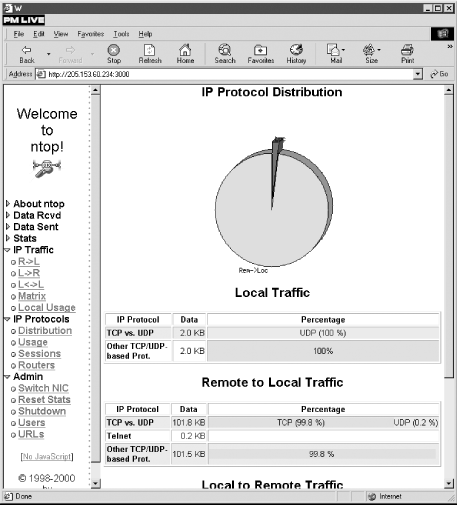
An important issue in capacity
planning is what percentage of traffic is purely local and what
percentage has a remote network for its source or destination (see
the sidebar "Local Versus Remote Traffic"). The IP Traffic menu
gives you options to collect this type of information. The
Distribution option on the IP Protocols menu gives you plots and
tables for local and remote IP traffic. For example,
Figure 8-5 shows a graph and tables for local and
remote-to-local traffic. There is a local-to-remote table that is not
shown. The Usage option shows IP subnet usage by port. Sessions shows
active TCP sessions, and Routers identifies routers on the local
subnet.
Figure 8-5. Measuring local and remote traffic
Local Versus Remote Traffic
Before the Internet became popular,
most network traffic stayed on the local network. This was often
summarized as the 90-10 Rule (or sometimes the 80-20 Rule), a
heuristic that says that roughly 90% of network traffic will stay on
the local network. The Internet has turned the old 90-10 Rule on its
head by providing a world of reasons to leave the local network; now
most traffic does just that. Today the 90-10 Rule says that 90% of
traffic on the local network will have a remote site as its source or
destination.
Clearly, the 90-10 Rule is nothing more than a very general rule of
thumb. It may be an entirely inappropriate generalization for your
network. But knowing the percentage of local and remote traffic can
be useful in understanding your network in a couple of ways. First,
whatever the numbers, they really shouldn't be changing a lot
over time unless something fundamental is changing in the way your
network is being used. This is something you'll want to know
about.
Second, local versus remote traffic provides a quick sanity check for
network design. If 90% of your traffic is entering or leaving your
network over a 1.544-Mbps T1 line, you should probably think very
carefully about why you need to upgrade your backbone to gigabit
speeds.
|
The last menu, Admin, is used to
control the operation of
ntop. Switch NIC allows
you to capture on a different interface, and Reset Stats zeros all
cumulative statistics. Shutdown shuts down
ntop.
Users and URLs allow you to control access to
ntop.
A number of command-line options allow
you to control how
ntop runs. These can be
listed with the
-h option. As noted previously,
-w is used to change the port it listens to, and
-i allows you to specify which interface to
listen to.
-r sets the delay between screen
updates in seconds. The
-n option is used to
specify numeric IP addresses rather than hostnames. Consult the
documentation for other options.
ntop has other features not discussed
here. It can be used as a lightweight intrusion detection system. It
provides basic access control and can be used with secure HTTP. It
also provides facilities to log data, including logging to a SQL
database.
As previously noted, the real problem with point monitoring is that
it doesn't really work well with segmented or switched
networks. Unless you are mirroring all traffic to your test host,
many of these numbers can be meaningless. If this is the case,
you'll want to collect information from a number of
sources.


