 | CGI Programming with Perl |  |

Several modules are available on CPAN that work with GD. Some provide convenience methods that make it easier to interact with GD. Others use GD to create graphs easily. In this section, we will look at GD::Text, which helps place text in GD images, and GD::Graph, the most popular graphing module, along with extensions provided by GD::Graph3D.
GD::Text is collection of modules for managing text, written by Martin Verbruggen. GD::Text provides three modules for working with text in GD images: GD::Text provides information about the size of text in GD, GD::Text::Align allows us to place text in GD with greater control, and GD::Text::Wrap allows us to place text boxes containing wrapped text. We don't have the space to cover all three of these modules in detail, but let's take a look at what is probably the most useful of these modules, GD::Text::Align.
In our previous example, loads.cgi, we used preset constants to determine the starting position of our centered title, "System Load Average." These values are derived from trial and error, and although not elegant, this approach works for images when the title is fixed. However, if someone decides to change the title of this image, the coordinates also need to be adjusted to keep the new title centered horizontally. And for images with dynamic titles, this approach will simply not work. A much better solution would be to calculate the title's placement dynamically.
GD::Text::Align allows us to do this easily. In the above example, the TITLE_Y_COORD constant is really the top margin, and TITLE_X_COORD is the left margin (remember coordinates start at the top left corner of the image in GD). There is nothing wrong with a constant for the top margin, but if we want to have a centered title, then we should calculate TITLE_X_COORD dynamically.
Thus, let's look at how we could modify loads.cgi to do this with GD::Text::Align. First, let's include the GD::Text::Align module at the start of the script:
use GD::Text::Align;
Next, we can replace the line that places the title string (in the area_graph subroutine) with the following:
# Add Centered Title
my $title = GD::Text::Align->new(
    $image,
    font    => gdLargeFont,
    text    => TITLE_TEXT,
    color   => $text_color,
    valign  => "top",
    halign  => "center",
);
$title->draw( IMAGE_SIZE / 2, TITLE_Y_COORD );
We create a GD::Text::Align object by passing our GD object, $image, and a number of parameters describing our text, and the draw method adds our title to the image. We should then remove the TITLE_X_COORD constant, which we know longer use; you may also want to rename TITLE_Y_COORD to something more meaningful in this context, such as TITLE_TOP_MARGIN.
Besides allowing you to place aligned text, GD::Text::Align also lets you obtain coordinates for the bounding box for a text string before you place it so you can make adjustments if necessary (such as reducing the size of the font). It also supports True Type fonts and placing text at angles. Refer to the GD::Text::Align online documentation for more information.
GD::Graph, also by Martin Verbruggen, is a collection of modules that produce graphs using GD. GD::Graph has had a few different names within the last year. It was originally called GIFgraph. However, after GD removed support for GIF, it no longer produced GIFs; in fact, it broke. Steve Bonds updated it to use PNG and renamed it as Chart::PNGgraph. Later, Martin Verbruggen gave it the more general name, GD::Graph, and removed specific image format support. Previously, you called the plot method to retrieve the graph in either GIF (for GIFgraph) or PNG (for PNGgraph) formats. Now, plot returns a GD::Image object so the user can choose the format desired. We'll see how this works in a moment.
To install GD::Graph, you must first have GD and GD::Text installed. GD::Graph provides the following modules for creating graphs:
GD::Graph::area creates area charts, as shown in Figure 13-2.

GD::Graph::bars creates bar charts, as shown in Figure 13-3.

GD::Graph::lines creates line charts, as shown in Figure 13-4.

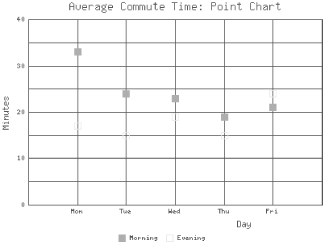
GD::Graph::points creates point charts (also sometimes called XY or scatter charts), as shown in Figure 13-5.
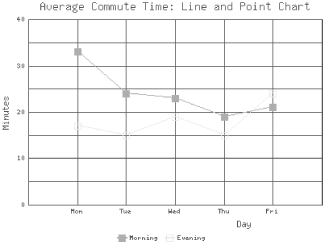
GD::Graph::linespoints creates a combination of line and point charts, as shown in Figure 13-6.
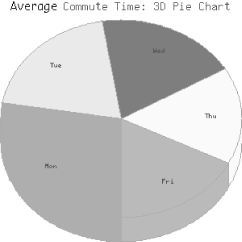
GD::Graph::pie creates pie charts, as shown in Figure 13-7.

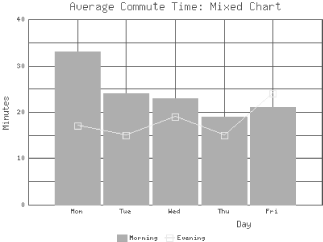
GD::Graph::mixed allows you to create a combination of any of the previous types except pie charts, as shown in Figure 13-8.
Each of the previous examples uses the data shown in Table 13-1.
|
Weekday |
Monday |
Tuesday |
Wednesday |
Thursday |
Friday |
|---|---|---|---|---|---|
|
Morning |
33 |
24 |
23 |
19 |
21 |
|
Evening |
17 |
15 |
19 |
15 |
24 |
Example 13-3 contains the code used to create the mixed graph that appears in Figure 13-8.
#!/usr/bin/perl -wT

use strict;
use CGI;
use GD::Graph::mixed;

use constant TITLE => "Average Commute Time: Mixed Chart";

my $q     = new CGI;
my $graph = new GD::Graph::mixed( 400, 300 );
my @data  = (
    [ qw( Mon  Tue  Wed  Thu  Fri ) ],
    [      33,  24,  23,  19,  21   ],
    [      17,  15,  19,  15,  24   ],
);


$graph->set(
    title           => TITLE,
    x_label         => "Day",
    y_label         => "Minutes",
    long_ticks      => 1,
    y_max_value     => 40,
    y_min_value     => 0,
    y_tick_number   => 8,
    y_label_skip    => 2,
    bar_spacing     => 4,
    types           => [ "bars", "linespoints" ],
);

$graph->set_legend( "Morning", "Evening" );
my $gd_image = $graph->plot( \@data );

print $q->header( -type => "image/png", -expires => "now" );

binmode STDOUT;
print $gd_image->png;
Note that for this script we do not need to use the GD module because we are not creating images directly; we simply use the GD::Graph module. We set one constant for the title of the graph. We could have created many more constants for the different parameters we are passing to GD::Graph, but this script is short, and not using constants allows you to easily see the values each parameter takes.
We create a mixed graph object by passing the width and height in pixels, and we set up our data. Then, we call the set method to set parameters for our graph. The meaning of some of these parameters is obvious; we will just explain those that may not be. long_ticks sets whether ticks should extend through the area of the chart to form a grid. y_tick_number specifies how many ticks the y axis should be divided into. y_label_skip sets how often the ticks on the y axis should be labelled; our setting, 2, means every other one. bar_spacing is the number of pixels between the bars (for the bars series). Finally, types sets the graph type of each series.
We add a legend that describes our data series. Next, we call the plot method with our data and receive a GD::Image object containing our new graph. Then all we need to do is generate our header and output the image as a PNG.
We won't look at code for each image type, because except for pie charts, this same code can generate each of the other types of images with very few modifications. You simply need to change GD::Graph::mixed to the name of the module you wish to use. The only property in the set method here that is particular to mixed graphs is types. The only property particular to mixed charts or bar charts is bar_spacing. The others are common across all the other types.
Pie charts are somewhat different. They only accept a single data series, they cannot have a legend, and because they have no axes, most of the parameters we just discussed do not apply to them. Furthermore, pie charts are three-dimensional by default. Example 13-4 provides the code used to create the pie chart that's shown in Figure 13-7.
#!/usr/bin/perl -wT

use strict;
use CGI;
use GD::Graph::pie;

use constant TITLE => "Average Commute Time: Pie Chart";

my $q     = new CGI;
my $graph = new GD::Graph::pie( 300, 300 );
my @data  = (
    [ qw( Mon  Tue  Wed  Thu  Fri ) ],
    [      33,  24,  23,  19,  21   ]
);


$graph->set(
    title           => TITLE,
    '3d'            => 0
);

my $gd_image = $graph->plot( \@data );

print $q->header( -type => "image/png", -expires => "-1d" );

binmode STDOUT;
print $gd_image->png;
This script is much shorter because we do not set nearly so many parameters. Instead, we simply set the title and turn the 3d option off (we will return to this concept in the next section). We also used 300 × 300 for the size of the graph instead of 400 × 300. GD::Graph will scale a pie chart to fit the edges of the graph, so pie charts will be elliptical if they are plotted in a rectangular region. Finally, we submit only one series of data and omit the call to add a legend, which is currently unsupported for pie charts.
GD::Graph3D allows us to generate three-dimensional charts. It is an extension to GD::Graph that provides three additional modules:
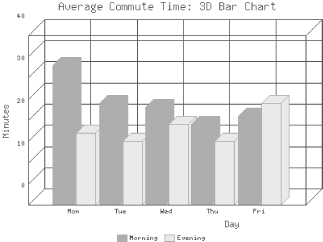
GD::Graph::bars3d creates three-dimensional bar charts, as shown in Figure 13-9.
GD::Graph::lines3d creates three-dimensional line charts, as shown in Figure 13-10.

GD::Graph::pie3d creates three-dimensional pie charts, as shown in Figure 13-11. This module actually just calls GD::Graph::pie, which now generates three-dimensional pie charts by default anyhow. It is included simply to provide a name consistent with the other two modules. In order to make the usage clear and consistent, perhaps GD::Graph::pie will ultimately default to non-three-dimensional pie charts and GD::Graph::pie3d can become the preferred way to generate a 3D version.
In order to use these modules, simply replace the standard module name with the 3D module name; all other properties and methods remain the same. Additionally, the 3D bar chart and 3D line chart each offer methods to set the depth of the bars and lines. Refer to the included documentation. Note that although the module is distributed as GD::Graph3d, the documentation is installed, along with the additional graph types, in the GD/Graph directory, so to view the documentation for GD::Graph3d, you must reference it this way:
$ perldoc GD::Graph::Graph3d

Copyright © 2001 O'Reilly & Associates. All rights reserved.